Please be informed, that the High Qualification Commission of Judges of Ukraine has completed testing of general knowledge in the field of law and specialisation of local commercial court, which lasted from August 11 to 13, 2025.
I. Composition of participants admitted to the second stage of the qualification exam – testing of general knowledge in the field of law and specialisation of the local commercial court.
A total of 2,237 persons were admitted to the testing of general knowledge in the field of law and specialisation of the local commercial court:
local court judges – 118:
judges of administrative courts – 4;
judges of commercial courts – 7;
judges of general courts – 107;
candidates for the position of judge – 2,119:
court staff – 648;
Prosecutor’s Office employees – 463;
attorneys– 312;
military personnel – 90;
representatives of other professions – 606.
Gender composition of participants admitted to the second stage of the qualification exam (testing of general knowledge in the field of law and specialisation of the local commercial court)
|
|
||||
|
No |
Place of work |
Women (persons) |
Men (persons) |
TOTAL |
|
1. |
Local court judges |
61 |
57 |
118 |
|
1.1. |
Judges of administrative courts |
2 |
2 |
4 |
|
1.2. |
Judges of commercial courts |
2 |
5 |
7 |
|
1.3. |
Judges of general courts |
57 |
50 |
107 |
|
2. |
Candidates for the position of judge |
1073 |
1046 |
2119 |
|
2.1. |
Court staff |
421 |
227 |
648 |
|
2.2. |
Prosecutor’s Office employees |
207 |
256 |
463 |
|
2.3. |
Attorneys |
142 |
170 |
312 |
|
2.4. |
Military personnel |
3 |
87 |
90 |
|
2.5. |
Representatives of other professions |
300 |
306 |
606 |
|
TOTAL |
1134 |
1103 |
2237 |
|
The overall gender balance of test participants remains relatively even:
women — 51%,
men — 49%.
There is an even gender balance among the participants in the selection process – 49% men and 51% women, and among the judges as well – 48% men and 52% women.
The highest rate of female participation was recorded among court staff — 65%; the highest percentage of men — among military personnel (97%).
There is a relative gender balance in the categories of attorneys, Prosecutor’s Office employees and representatives of other professions.
Overall, the results indicate an appropriate level of gender representation in the selection procedure.
Age composition of participants admitted to the second stage of the qualification exam – (testing of general knowledge in the field of law and specialisation of the local commercial court)
|
* age at the time of submitting documents for participation in the selection |
|||||
|
No. |
Place of work |
From 30 To 35 years old (persons*) |
From 36 To 40 years old (persons*) |
41 years and older (persons*) |
TOTAL |
|
1. |
Local court judges |
0 |
47 |
71 |
118 |
|
1.1. |
Judges of administrative courts |
0 |
4 |
0 |
4 |
|
1.2. |
Judges of commercial courts |
0 |
4 |
3 |
7 |
|
1.3. |
Judges of general courts |
0 |
39 |
68 |
107 |
|
2. |
Candidates for the position of judge |
846 |
741 |
532 |
2119 |
|
2.1. |
Court staff |
290 |
236 |
122 |
648 |
|
2.2. |
Prosecutor’s Office employees |
220 |
150 |
93 |
463 |
|
2.3. |
Attorneys |
110 |
106 |
96 |
312 |
|
2.4. |
Military personnel |
26 |
35 |
29 |
90 |
|
2.5. |
Representatives of other professions |
200 |
214 |
192 |
606 |
|
TOTAL |
846 |
788 |
603 |
2237 |
|
Local court judges who intend to be transferred to another local court are mostly over 40 years old (60%), there are no judges younger than 36. This trend is justified by the long break in the possibility of exercising a judge’s right to transfer to another local court.
Among the candidates for the position of judge, almost half of them (40%) are persons aged 30–35, and 75% of candidates are younger than 41.
Courts staff and Prosecutor’s office employees are the youngest categories: aged 30–35 — 45% and 48%, respectively.
Attorneyes, military personnel and other professions have a relatively even distribution of age groups.
Regional composition of participants admitted to the second stage of the qualification exam (testing of general knowledge in the field of law and specialisation of the local commercial court)
|
No. |
Region |
Judges (persons) |
Candidates for the position of judge (individuals) |
TOTAL |
|||||
|
Сourt apparatus |
Prosecutor's Office employees |
Attorneys |
Military personnel |
Other professions |
Total |
||||
|
1 |
Vinnytsia Oblast |
4 |
13 |
14 |
10 |
4 |
16 |
57 |
61 |
|
2 |
Volyn Oblast |
4 |
16 |
15 |
8 |
0 |
23 |
62 |
66 |
|
3 |
Dnipropetrovsk Oblast |
13 |
36 |
44 |
24 |
3 |
54 |
161 |
174 |
|
4 |
Donetsk Oblast |
4 |
1 |
1 |
0 |
0 |
1 |
3 |
7 |
|
5 |
Zhytomyr Oblast |
6 |
10 |
23 |
8 |
1 |
6 |
48 |
54 |
|
6 |
Transcarpathian Oblast |
3 |
19 |
9 |
6 |
0 |
17 |
51 |
54 |
|
7 |
Zaporizhzhia Oblast |
4 |
11 |
22 |
9 |
4 |
19 |
65 |
69 |
|
8 |
Ivano-Frankivsk Oblast |
5 |
15 |
21 |
7 |
1 |
20 |
64 |
69 |
|
9 |
Kyiv Oblast |
6 |
47 |
13 |
26 |
9 |
48 |
143 |
149 |
|
10 |
Kirovohrad Oblast |
6 |
19 |
7 |
5 |
2 |
8 |
41 |
47 |
|
11 |
Luhansk Oblast |
4 |
0 |
0 |
0 |
0 |
0 |
0 |
4 |
|
12 |
Lviv Oblast |
2 |
72 |
43 |
27 |
8 |
54 |
204 |
206 |
|
13 |
Mykolaiv Oblast |
3 |
5 |
10 |
4 |
1 |
7 |
27 |
30 |
|
14 |
Odesa Oblast |
6 |
31 |
36 |
25 |
7 |
42 |
141 |
147 |
|
15 |
Poltava Oblast |
6 |
12 |
19 |
10 |
4 |
21 |
66 |
72 |
|
16 |
Rivne Oblast |
3 |
46 |
16 |
19 |
5 |
22 |
108 |
111 |
|
17 |
Sumy Oblast |
2 |
18 |
19 |
9 |
2 |
18 |
66 |
68 |
|
18 |
Ternopil Oblast |
6 |
7 |
6 |
7 |
0 |
18 |
38 |
44 |
|
19 |
Kharkiv Oblast |
8 |
63 |
27 |
15 |
5 |
30 |
140 |
148 |
|
20 |
Kherson Oblast |
3 |
1 |
3 |
1 |
1 |
3 |
9 |
12 |
|
21 |
Khmelnytskyi Oblast |
1 |
15 |
11 |
6 |
3 |
10 |
45 |
46 |
|
22 |
Cherkasy Oblast |
5 |
9 |
4 |
13 |
2 |
15 |
43 |
48 |
|
23 |
Chernivtsi Oblast |
3 |
5 |
8 |
3 |
2 |
6 |
24 |
27 |
|
24 |
Chernihiv Oblast |
6 |
15 |
21 |
8 |
2 |
11 |
57 |
63 |
|
25 |
Kyiv City |
5 |
162 |
71 |
62 |
24 |
135 |
454 |
459 |
|
26 |
another country |
0 |
0 |
0 |
0 |
0 |
2 |
2 |
2 |
|
TOTAL |
118 |
648 |
463 |
312 |
90 |
606 |
2119 |
2 237 |
|
The city of Kyiv confidently leads in the number of people wishing to become judges —21% of all participants.
The largest participation of candidates for the position of judge was provided by the city of Kyiv, Dnipropetrovsk, Lviv, Kharkiv, Kyiv and Odesa Oblasts – together over 63% of the total number of candidates.
II. Success rate of passing the testing of general knowledge in the field of law and specialisation of the local commercial court
835 persons, or 37% of the total number of participants, did not appear for the test:
- Local general court judges – 35 persons, or 30% of the total number of persons in this group;
- Candidates for the position of judge – 800 persons, or 38% of the total number of persons in this group;
- court staff – 201 personss, or 31% of the total number of persons in this group;
- Prosecutor’s Office employees – 232 persons, or 50% of the total number of persons in this group;
- attorneys – 103 persons, or 33% of the total number of persons in this group;
- representatives of other professions – 235 persons, or 39% of the total number of persons in this group;
- military personnel – 29 persons, or 32% of the total number of persons in this group.
The minimum acceptable test score is 75 points, or 112,5 points in case of applying the 1.5 coeficient.
The maximum test score is 100 points or 150 points in case of applying the 1.5 coeficient.
|
Success rate of the second stage of the qualification exam “Testing of general knowledge in the field of law and specialisation of the local commercial court” |
|||||||||||
|
No. |
Place of work |
74 points or less (or less than 111 points when applying a coefficient of 1.5) |
from 75 to 93 points (or from 112.5 to 139.5 points applying a coefficient of 1.5) |
from 94 to 97 points (or from 141 to 145.5 points applying a coefficient of 1.5) |
from 98 to 100 points (or from 147 to 150 points applying a coefficient of 1.5) |
TOTAL |
|||||
|
persons |
%* |
persons |
%* |
persons |
%* |
persons |
%* |
persons |
%* |
||
|
1. |
Local court judges |
0 |
0,0% |
10 |
12,0% |
19 |
22,9% |
54 |
65,1% |
83 |
100,0% |
|
1.1. |
Judges of administrative courts |
0 |
0,0% |
1 |
25,0% |
1 |
25,0% |
2 |
50,0% |
4 |
100,0% |
|
1.2. |
Judges of commercial courts |
0 |
0,0% |
2 |
28,6% |
1 |
14,3% |
4 |
57,1% |
7 |
100,0% |
|
1.3. |
Judges of general courts |
0 |
0,0% |
7 |
9,7% |
17 |
23,6% |
48 |
66,7% |
72 |
100,0% |
|
2. |
Candidates for the position of judge |
39 |
3,0% |
307 |
23,3% |
276 |
20,9% |
697 |
52,8% |
1319 |
100,0% |
|
2.1. |
Court staff |
6 |
1,3% |
99 |
22,1% |
88 |
19,7% |
254 |
56,8% |
447 |
33,9% |
|
2.2. |
Prosecutor’s Office employees |
5 |
2,2% |
46 |
19,9% |
41 |
17,7% |
139 |
60,2% |
231 |
17,5% |
|
2.3. |
Attorneys |
3 |
1,4% |
51 |
24,4% |
51 |
24,4% |
104 |
49,8% |
209 |
15,8% |
|
2.4. |
Military personnel |
1 |
1,6% |
18 |
29,5% |
19 |
31,1% |
23 |
37,7% |
61 |
4,6% |
|
2.5. |
Representatives of other professions |
24 |
6,5% |
93 |
25,1% |
77 |
20,8% |
177 |
47,7% |
371 |
28,1% |
|
TOTAL |
39 |
2,8% |
317 |
22,6% |
295 |
21,0% |
751 |
53,6% |
1402 |
100,0% |
|
In accordance with the decision of the High Qualification Commission of Judges of Ukraine dated May 12, 2025, No. 105/zp-25, the passing score for the second stage of the qualification exam (testing of general knowledge in the field of law and knowledge of the specialisation of the relevant court) is determined on the basis that candidates admitted to the third stage are those who have scored not less than 75 percent of the maximum possible score, in a number three times greater than the projected number of vacant judicial positions in local courts, namely: 600 – in local commercial courts.
If two or more candidates for the position of judge receive the same lowest passing score of the second stage of the qualification exam, all such candidates shall be admitted to the third stage of the qualification exam.
Based on the results of the second stage of the qualification exam – testing of general knowledge in the field of law and knowledge of the specialisation of the local commercial court – by decision of the High Qualification Commission of Judges of Ukraine dated August 15, 2025,
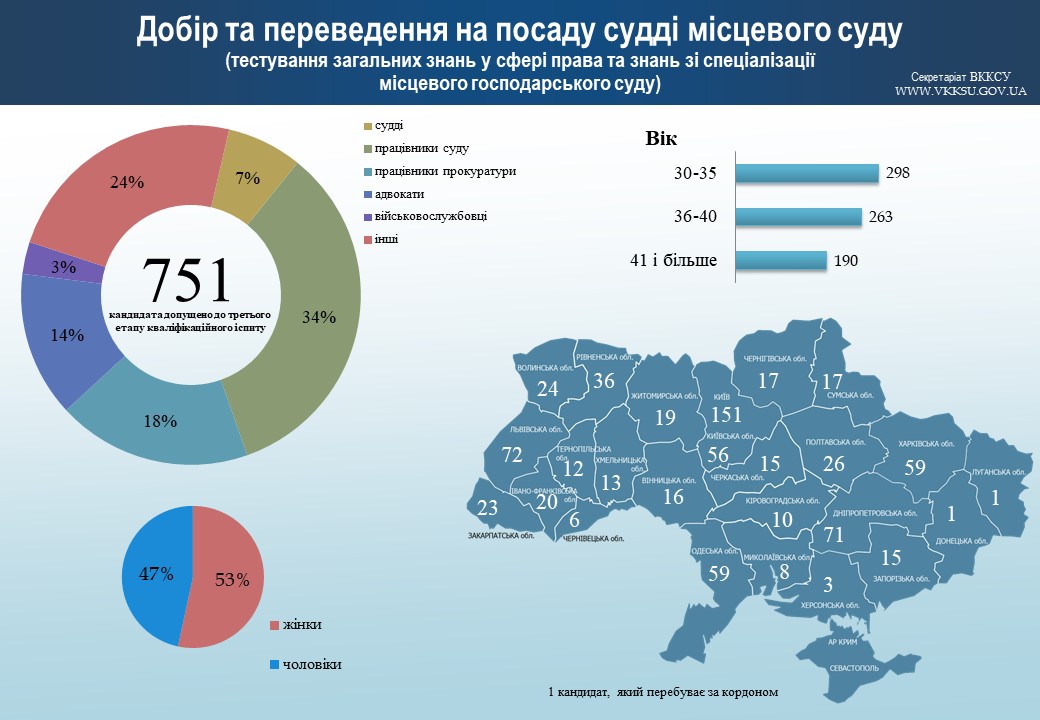
751 persons were admitted to the third stage.
III. Composition of participants admitted to the third stage of the qualification exam – testing of cognitive abilities (local commercial court specialisation)
A total of 751 persons were admitted to testing of cognitive abilities (local commercial court specialisation)
1) by the composition of the participants:
a) judges of local courts – 54:
- judges of administrative courts – 2;
- judges of commercial courts – 4;
- judges of general courts – 48;
b) candidates for the position of judge – 697:
- court staff – 254;
- prosecutor’s office employees – 139;
- attorneys – 104;
- representatives of other professions – 177;
- military personnel – 23.
Gender composition of participants admitted to the third stage of the qualification exam – testing of cognitive abilities (local commercial court specialisation)
|
No |
Place of work |
Women |
Men |
TOTAL |
|||
|
persons |
%* |
persons |
%* |
persons |
%* |
||
|
1. |
Local court judges |
31 |
57% |
23 |
43% |
54 |
100% |
|
1.1. |
Judges of administrative courts |
1 |
50% |
1 |
50% |
2 |
4% |
|
1.2. |
Judges of commercial courts |
1 |
25% |
3 |
75% |
4 |
7% |
|
1.3. |
Judges of general courts |
29 |
60% |
19 |
40% |
48 |
89% |
|
2. |
Candidates for the position of judge |
370 |
53% |
327 |
47% |
697 |
100% |
|
2.1. |
Court staff |
157 |
62% |
97 |
38% |
254 |
36% |
|
2.2. |
Prosecutor’s Office employees |
73 |
53% |
66 |
47% |
139 |
20% |
|
2.3. |
Attorneys |
47 |
45% |
57 |
55% |
104 |
15% |
|
2.4. |
Military personnel |
2 |
9% |
21 |
91% |
23 |
3% |
|
2.5. |
Representatives of other professions |
91 |
51% |
86 |
49% |
177 |
25% |
|
TOTAL |
401 |
53% |
350 |
47% |
751 |
100% |
|
Among the participants admitted to the third stage of the qualification exam, there is a higher percentage of women:
women — 401 persons, or 53% of the total number of participants;
men — 350 persons, or 47% of the total number of participants.
The highest rate of female participation was recorded among court staff — 62% and judges – 57%; the highest percentage of men — among military personnel (91%) and attorneys (55 %).
There is a relative gender balance in the categories of Prosecutor’s office employees and representatives of other professions.
Overall, the results indicate an appropriate level of gender representation in the selection procedure.
Age composition of participants admitted to the third stage of the qualification exam – testing of cognitive abilities (local commercial court specialisation)
|
* age at the time of submitting documents for participation in the selection |
|||||||||
|
No |
Place of work |
From 30 to 35 years old |
From 36 to 40 years old |
41 years and older |
TOTAL |
||||
|
persons* |
%* |
persons* |
%* |
persons* |
%* |
persons* |
%* |
||
|
1. |
Local court judges |
0 |
0% |
22 |
41% |
32 |
59% |
54 |
100% |
|
1.1. |
Judges of administrative courts |
0 |
0% |
2 |
100% |
0 |
0% |
2 |
4% |
|
1.2. |
Judges of commercial courts |
0 |
0% |
2 |
50% |
2 |
50% |
4 |
7% |
|
1.3. |
Judges of general courts |
0 |
0% |
18 |
37% |
30 |
63% |
48 |
89% |
|
2. |
Candidates for the position of judge |
298 |
43% |
241 |
35% |
158 |
23% |
697 |
100% |
|
2.1. |
Court staff |
118 |
46% |
99 |
39% |
37 |
15% |
254 |
36% |
|
2.2. |
Prosecutor’s Office employees |
70 |
50% |
43 |
31% |
26 |
19% |
139 |
20% |
|
2.3. |
Attorneys |
43 |
41% |
34 |
33% |
27 |
26% |
104 |
15% |
|
2.4. |
Military personnel |
10 |
43% |
6 |
26% |
7 |
30% |
23 |
3% |
|
2.5. |
Representatives of other professions |
57 |
32% |
59 |
33% |
61 |
34% |
177 |
25% |
|
TOTAL |
298 |
40% |
263 |
35% |
190 |
25% |
751 |
100% |
|
Local court judges who intend to be transferred to another local court are mostly over 40 years old (59%), there are no judges younger than 36 years old among them.
Among candidates for the position of judge, 77% are younger than 41 years old.
Courts staff employees, Prosecutor’s Office employees, attorneys and military personnel are the youngest categories: aged 30–35 — 46%, 50%, 41% and 43 % respectively.
Other professions representatives have a relatively even distribution of age groups.
Regional composition of participants admitted to the third stage of the qualification exam – testing of cognitive abilities (local commercial court specialisation)
|
Regional composition of participants admitted to the second stage of the qualification exam (testing of general knowledge in the field of law and court specialisations) |
|||||||||||||||||
|
No. |
Region |
Judges |
Candidates for the position of judge (persons) |
TOTAL |
|||||||||||||
|
(persons) |
Court apparatus |
Prosecutor’s Office |
Attorneyes |
Military personnel |
Other professions |
Total |
|||||||||||
|
persons |
% |
persons |
% |
persons |
% |
persons |
% |
persons |
% |
persons |
% |
persons |
% |
persons |
% |
||
|
1 |
Vinnytsia Oblast |
1 |
6,3% |
5 |
33,3% |
3 |
20,0% |
2 |
13,3% |
1 |
6,7% |
4 |
26,7% |
15 |
94% |
16 |
2,1% |
|
2 |
Volyn Oblast |
3 |
12,5% |
6 |
28,6% |
7 |
33,3% |
3 |
14,3% |
0 |
0,0% |
5 |
23,8% |
21 |
88% |
24 |
3,2% |
|
3 |
Dnipropetrovsk Oblast |
2 |
2,8% |
18 |
26,1% |
16 |
23,2% |
11 |
15,9% |
1 |
1,4% |
23 |
33,3% |
69 |
97% |
71 |
9,5% |
|
4 |
Donetsk Oblast |
1 |
100,0% |
0 |
0,0% |
0 |
0,0% |
0 |
0,0% |
0 |
0,0% |
0 |
0,0% |
0 |
0% |
1 |
0,1% |
|
5 |
Zhytomyr Oblast |
2 |
10,5% |
4 |
23,5% |
8 |
47,1% |
3 |
17,6% |
0 |
0,0% |
2 |
11,8% |
17 |
89% |
19 |
2,5% |
|
6 |
Transcarpathian Oblast |
1 |
4,3% |
9 |
40,9% |
5 |
22,7% |
2 |
9,1% |
0 |
0,0% |
6 |
27,3% |
22 |
96% |
23 |
3,1% |
|
7 |
Zaporizhzhia Oblast |
0 |
0,0% |
1 |
6,7% |
5 |
33,3% |
3 |
20,0% |
0 |
0,0% |
6 |
40,0% |
15 |
100% |
15 |
2,0% |
|
8 |
Ivano-Frankivsk Oblast |
4 |
20,0% |
6 |
37,5% |
6 |
37,5% |
3 |
18,8% |
0 |
0,0% |
1 |
6.3% |
16 |
80% |
20 |
2,7% |
|
9 |
Kyiv Oblast |
5 |
8,9% |
19 |
37,3% |
6 |
11,8% |
10 |
19,6% |
1 |
2,0% |
15 |
29,4% |
51 |
91% |
56 |
7,5% |
|
10 |
Kirovohrad Oblast |
1 |
10,0% |
6 |
66,7% |
1 |
11,1% |
0 |
0,0% |
1 |
11,1% |
1 |
11,1% |
9 |
90% |
10 |
1,3% |
|
11 |
Luhansk Oblast |
1 |
100,0% |
0 |
0,0% |
0 |
0,0% |
0 |
0,0% |
0 |
0,0% |
0 |
0,0% |
0 |
0% |
1 |
0,1% |
|
12 |
Lviv Oblast |
0 |
0,0% |
29 |
40,3% |
8 |
11,1% |
13 |
18,1% |
2 |
2,8% |
20 |
27,8% |
72 |
100% |
72 |
9,6% |
|
13 |
Mykolaiv Oblast |
1 |
12,5% |
1 |
14,3% |
2 |
28,6% |
1 |
14,3% |
0 |
0,0% |
3 |
42,9% |
7 |
88% |
8 |
1,1% |
|
14 |
Odesa Oblast |
2 |
3,4% |
17 |
29,8% |
11 |
19,3% |
9 |
15,8% |
3 |
5,3% |
17 |
29,8% |
57 |
97% |
59 |
7,9% |
|
15 |
Poltava Oblast |
6 |
23,1% |
1 |
5,0% |
7 |
35,0% |
2 |
10,0% |
3 |
15,0% |
7 |
35,0% |
20 |
77% |
26 |
3,5% |
|
16 |
Rivne Oblast |
1 |
2,8% |
17 |
48,6% |
8 |
22,9% |
3 |
8,6% |
1 |
2,9% |
6 |
17,1% |
35 |
97% |
36 |
4,8% |
|
17 |
Sumy Oblast |
2 |
11,8% |
2 |
13,3% |
7 |
46,7% |
2 |
13,3% |
0 |
0,0% |
4 |
26,7% |
15 |
88% |
17 |
2,3% |
|
18 |
Ternopil Oblast |
3 |
25,0% |
1 |
11,1% |
1 |
11,1% |
2 |
22,2% |
0 |
0,0% |
5 |
55,6% |
9 |
75% |
12 |
1,6% |
|
19 |
Kharkiv Oblast |
6 |
10,2% |
31 |
58,5% |
12 |
22,6% |
3 |
5,7% |
1 |
1,9% |
6 |
11,3% |
53 |
90% |
59 |
7,9% |
|
20 |
Kherson Oblast |
1 |
33,3% |
1 |
50,0% |
0 |
0,0% |
0 |
0,0% |
0 |
0,0% |
1 |
50,0% |
2 |
67% |
3 |
0,4% |
|
21 |
Khmelnytskyi Oblast |
0 |
0,0% |
4 |
30,8% |
3 |
23,1% |
2 |
15,4% |
1 |
7,7% |
3 |
23,1% |
13 |
100% |
13 |
1,7% |
|
22 |
Cherkasy Oblast |
3 |
20,0% |
3 |
25,0% |
1 |
8,3% |
3 |
25,0% |
1 |
8,3% |
4 |
33,3% |
12 |
80% |
15 |
2,0% |
|
23 |
Chernivtsi Oblast |
2 |
33,3% |
1 |
25,0% |
1 |
25,0% |
1 |
25,0% |
1 |
25,0% |
0 |
0,0% |
4 |
67% |
6 |
0,8% |
|
24 |
Chernihiv Oblast |
3 |
17,6% |
3 |
21,4% |
6 |
42,9% |
2 |
14,3% |
0 |
0,0% |
3 |
21,4% |
14 |
82% |
17 |
2,3% |
|
25 |
Kyiv City |
3 |
2,0% |
69 |
46,6% |
15 |
10,1% |
24 |
16,2% |
6 |
4,1% |
34 |
23,0% |
148 |
98% |
151 |
20,1% |
|
26 |
another country |
0 |
0,0% |
0 |
0,0% |
0 |
0,0% |
0 |
0,0% |
0 |
0,0% |
1 |
100,0% |
1 |
100% |
1 |
0,1% |
|
TOTAL |
54 |
7,2% |
254 |
36,4% |
139 |
19,9% |
104 |
14,9% |
23 |
3,3% |
177 |
25,4% |
697 |
93% |
751 |
100,% |
|